Usage
Usage is where the money went. Every model call the engine makes — a workflow node, a
chat turn, a delegated subagent, a dashboard build, an inline edit, a commit-message
draft, a request through the OpenAI-compatible gateway — emits a token.usage event, and
this page rolls them up by day, workflow, model, agent, and work item, then lets you click
through to the transcript of any run.
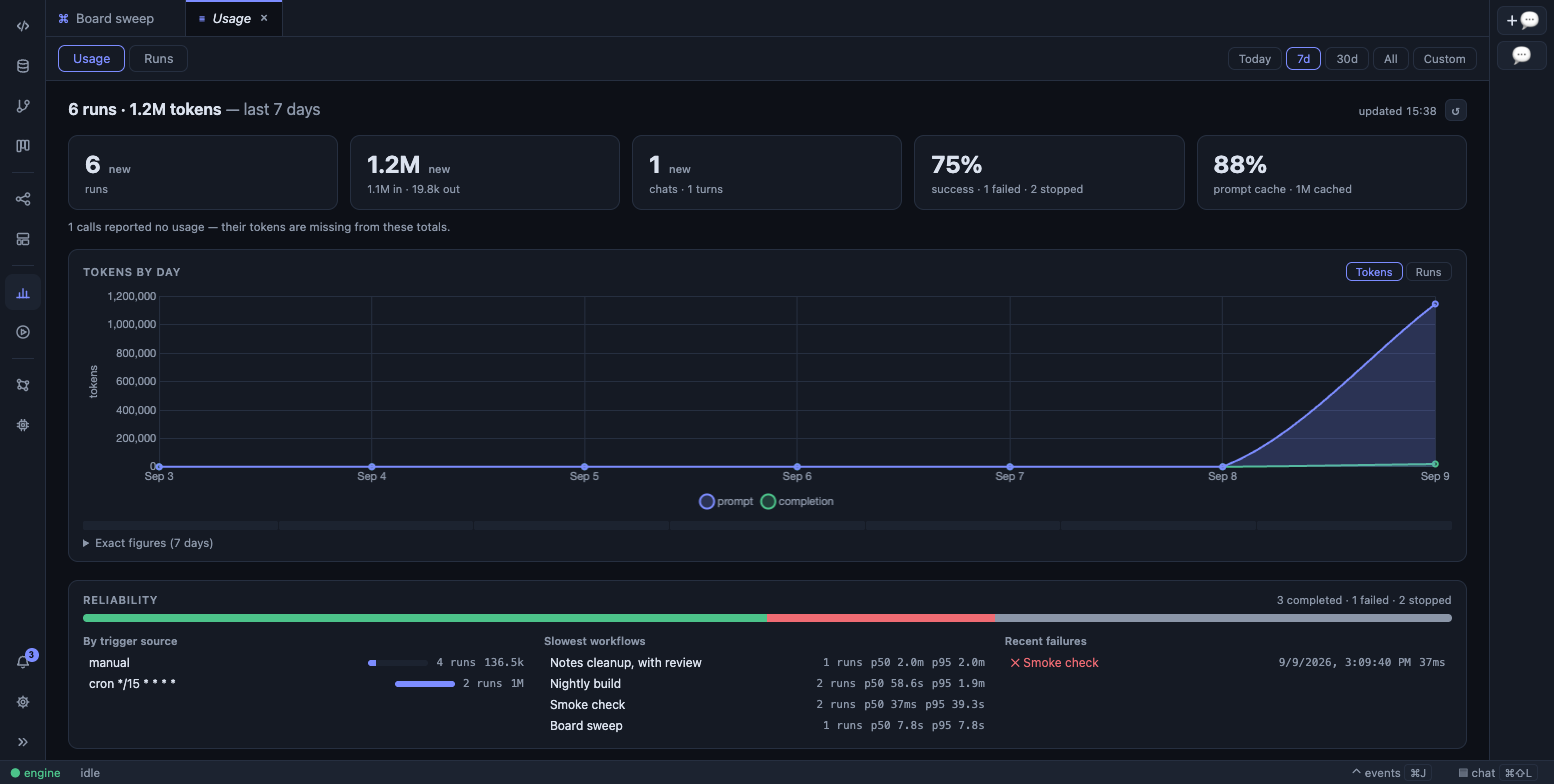
Tokens by day, the reliability panel, and the per-workflow and per-model tables.
Open it from Usage in the activity bar — the Audit group, above Runs — or ⌘⇧P →
Usage. It opens as a preview tab: glance at it and the next preview replaces it,
double-click the tab to pin it in place.
The range
Section titled “The range”Every number on the page is scoped to one range — Today, 7d, 30d, All, or a custom pair of dates — and the cards compare it to the equal-length period before. (All has no period before it, so it shows no deltas.) The choice persists. The page refreshes itself every three seconds while runs are in flight and every thirty otherwise, only while its tab is visible.
What you see
Section titled “What you see”Cards. Runs; tokens (in · out); chats and turns; the success rate, with failed,
running, stopped, and interrupted counts (click through to the failures — stopped and
interrupted sit beside the rate rather than in it, because neither says anything about the
workflow); the prompt cache hit rate, when any model in the range reported one; and
cost, when anything in the range is priced.
Tokens by day. An area chart split prompt/completion, with a Runs by day toggle and a table behind a disclosure. Click a day to see its runs.
Reliability. The outcome split; runs by trigger source — cron, webhook, file, manual, resume; the slowest workflows with p50 and p95 durations; and recent failures, each a click away from its transcript.
Tables — sortable, top ten with Show all, a share bar per row, and every row a drill-down into the run list with a removable filter chip:
| Table | Columns |
|---|---|
| By workflow | runs, tokens, cost |
| By model | calls, tokens, cached, cost |
| By agent | calls, tokens, cost |
| By work item | runs, tokens, cost — shown once any run has linked itself to a work item |
Chat turns aren’t a workflow, so they collect under a single chat row rather than a
mystery one. A run that touched two work items counts in both rows, and the table says so.
Runs and transcripts
Section titled “Runs and transcripts”The page’s second mode, Runs, is the transcript reader: a paged, filtered list beside
the full event log of whichever row you select. Switch between runs and chats; filter by
status, workflow, agent, model, trigger source, work item, or day — each arriving as a
removable chip when you drill in from a table — and narrow the loaded rows further with the
text box, which matches a workflow’s name or id and a run id. A transcript shows the run’s
token header, each
node starting and completing with its output, every tool call with its arguments and
result, shell commands with their exit code, file reads and writes, web fetches,
browser actions, database
queries with their connection, class, row counts and SQL,
permission denials, gate waits and resolutions, checkpoints, plan updates, and each
token.usage as it was booked. Chat transcripts render role, markdown, and tool rows.
Timestamps are local.
Runs older than this engine session are here too — the Runs sidebar and the workflow transcript panel are live views, and this is the one that reads across restarts.
Where the numbers come from
Section titled “Where the numbers come from”The source of truth is the append-only run log, <latchHome>/runs/<runId>.jsonl — chat turns
are runs too, named chat-<session>-<timestamp>. The engine projects those logs into a
SQLite read-model at <latchHome>/runs/report.db and re-reads any log whose size or
modification time changed, so a long chat turn’s tokens keep growing in the page as it
runs rather than freezing at the first poll. The index is disposable: it carries a schema
version, and a change to that version drops and rebuilds it from the logs.
Calls that don’t belong to a workflow or a chat are booked under synthetic runs so they can’t hide:
| Bucket | What it books |
|---|---|
aux:git |
Commit-message drafts and AI code reviews |
aux:inline-edit |
⌘K in the editor |
aux:complete |
Tab autocomplete |
aux:apply |
Apply-from-chat, when the free splice declines and a model has to merge |
aux:author |
Dashboard and atlas authoring — one row per retry |
aux:memory |
Memory consolidation |
aux:vault |
Quick capture into a vault |
gateway |
Requests through the OpenAI-compatible API |
The one deliberately uncounted call is the Models page’s Test connection: it dials the provider outside any run envelope, so it books nothing.
A call whose server reported no usage — an aborted request, a backend that omits the
field — is marked missing rather than read as zero, and the page says how many calls
are missing from its totals. The context-compaction summary a long agent loop makes is
billed to that run, not to nobody.
LatchAI prices tokens per model from a built-in table of Anthropic models — input and output per million tokens, with cache reads at a tenth of the input price and cache writes at 1.25×. Model ids are matched by substring, longest key first, so a served id carrying a date suffix or a vendor path still prices correctly. Cost is computed per call on the model the server actually echoed back, so a run that switched models mid-flight bills correctly.
A model with no price — every local model, every OpenAI-compatible endpoint — costs $0,
and its tokens are reported as unpriced so that zero is distinguishable from free. When
nothing in the range is priced, the cost card and every cost column disappear and the page
is a token report; when spend is mixed, a chip says N unpriced models with the token
count they’re hiding.
Prompt caching
Section titled “Prompt caching”When a server reports cache activity, it shows up here. OpenAI-compatible backends report
cached_tokens — which is where vLLM’s and llama.cpp’s prefix caching land — and count as
cache reads. Anthropic reports cache reads and cache creation separately, and LatchAI
reconstructs the real prompt total from the three parts the API returns.
The prompt cache card is reads over every prompt token in the range, including calls
to models whose server says nothing about caching at all — so a mixed instance reads low on
purpose. The Cached column in the by-model table is the honest per-model rate, with —
for a server that reports nothing.
LatchAI does not yet place cache breakpoints on Anthropic requests, so Anthropic’s cache counts are typically zero today; a local server with prefix caching on shows real numbers.
Cost per work item
Section titled “Cost per work item”Because a run that changes a work item records a work.updated
event in its log, the index joins runs to items — and tokens to runs — with no tagging on
anyone’s part. The By work item table is the roll-up; each item’s own page lists its
linked runs with their tokens and cost.
On the phone and over HTTP
Section titled “On the phone and over HTTP”The phone app carries a Usage screen of its own, under More: Today / 7 days / 30 days, the same totals and tokens-by-day chart, and the top workflows, models and agents — each a tap into the runs behind it. The reliability panel, the by-work-item table and the per-day figures are deliberately left on the desk; they are tables that would need horizontal scrolling on a phone. Spend appears only when the daemon reports one.
Both surfaces read the same two endpoints, and so can you:
GET /api/report for the summary and GET /api/report/runs
for the filtered run list.