Run Monitor
The Run Monitor is the “what is happening right now” surface: a read-only, chat-like view of everything in flight — streaming agent text, tool calls resolving in place, shell commands and their output, retries, plan updates, and gate pauses — in near-realtime.
It is non-interactive by design. It observes exactly the same event stream the canvas animates from, so it can never disagree with the canvas about what happened.
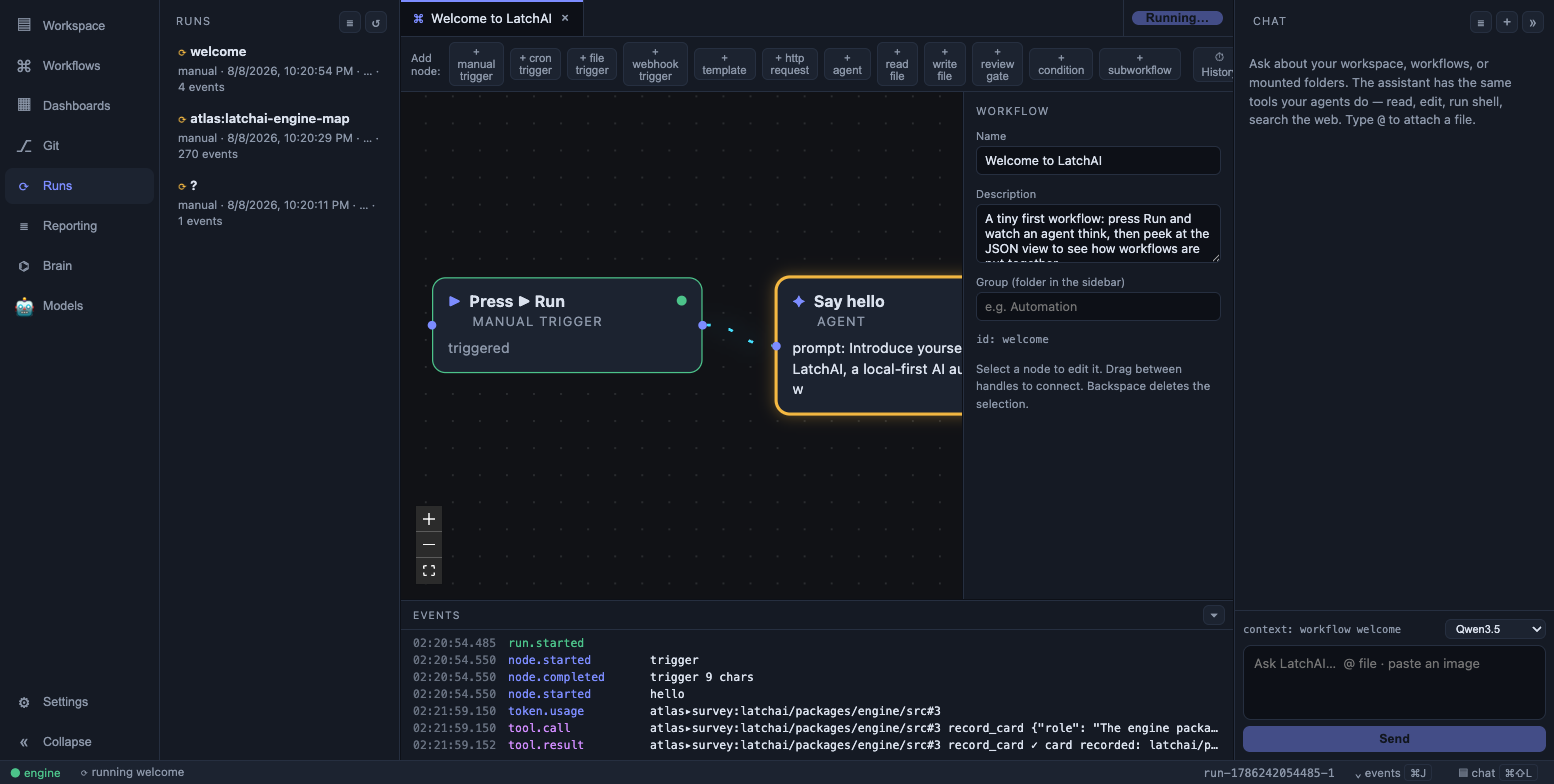
One feed for every run in flight, filterable to one.
Opening it
Section titled “Opening it”Click the running indicator in the status bar — it reads idle, ⟳ running <workflow> or ⟳ 3 running, and it is a button. Or ⌘⇧P → Monitor: Live Run
Feed. It opens as a tab like anything else, so you can leave it open beside the
code an agent is editing.
What’s in the feed
Section titled “What’s in the feed”Feed items are typed — status changes, streaming model text, tool calls, shell commands, and plans — each rendered with its own affordance rather than flattened into log lines. A tool call appears when it is issued and fills in when its result arrives, so a long-running call is visibly pending rather than absent.
Every item carries the name of the workflow it belongs to (its id in the tooltip), the node that produced it, and a timestamp:
| Item | Looks like | Comes from |
|---|---|---|
| Text 🤖 | A bubble that grows token by token, marked streaming… until it closes |
node.started opens it, node.delta fills it, node.completed closes it |
| Tool ⚙ | read_file {"path":"src/index.ts"}, marked running…, then → ✓ <preview> |
tool.call patched by tool.result |
Shell $ |
$ npm test then → exit 0 and the head of the output |
shell.exec |
| Plan ▤ | ☑ scaffold ▸ implement ☐ tests |
plan.update, from the set_plan tool |
| Database ⚙ | db analytics: select count(*) from events (1 rows, 12ms) |
db.query — a SQL call is a tool call |
Statuses punctuate the feed between them:
| Status line | When |
|---|---|
▶ nightly-build started (cron 0 2 * * *) |
run.started, naming the trigger source — manual, webhook, resume, file <path> or the cron expression |
✓ nightly-build completed |
run.completed |
✕ nightly-build failed: <error> |
run.failed |
■ nightly-build stopped |
run.stopped — someone pressed ⏹ |
⚠ nightly-build interrupted — the engine stopped mid-run (resumable) |
run.interrupted |
⊘ nightly-build: webhook skipped (already running) |
trigger.skipped — a fire that produced no run, with — <reason> when the document itself was refused |
◇ state.issues (append) = […] |
state.updated, previewed to 160 characters |
▦ morning-brief: 6 widget(s) published |
dashboard.published |
🗺 latchai-map: 3 view(s) published |
atlas.published |
⏸ review waiting for review / ☑ review approved / ☒ review rejected |
gate.waiting / gate.resolved |
Retries and handled failures
Section titled “Retries and handled failures”Since the per-node error policy landed, a node is not one call — it is up to
1 + retry.max attempts, and what happens after the last one is the author’s
choice. The feed says both parts out loud, because a run that is waiting out a
backoff otherwise looks exactly like a run that is stuck.
A retry is announced before the wait, as its own line rather than a patch of the open bubble:
↻ fetch-issues: attempt 1 failed (503 Service Unavailable) — retrying 2/4 in 1000msThat comes from node.retry, which the engine emits once per scheduled attempt
when a node declares a retry policy. The bubble
above it is still open — the node has not failed yet.
A failed node closes its bubble rather than leaving it spinning, and the mark says whether the run survived it:
✕ <node>: <error>— fatal, and the run fails with it (the default).⚠ <node>: <error> (handled — the run carries on)— the node’sonErrorwascontinueorbranch, so its output became{ ok: false, error, attempts }and the run can still endrun.completed. Not marked red, because nothing died.
Filtering
Section titled “Filtering”Newest runs come first in the filter, each labelled with its workflow’s name and the last six characters of its run id; the full id is in the option’s tooltip. Selecting a run narrows the feed to it; “all” shows everything the daemon is doing at once — which, with triggers armed, is often more than one thing.
Following
Section titled “Following”The feed auto-follows the stream only while you are pinned to the bottom. Scroll up to read something and it stops fighting you; scroll back down and following resumes.
Two caps keep a long night from eating the tab: 600 items across all runs, and
8,000 characters per streaming bubble (it keeps the tail, prefixed with …).
The full text is always in the run log on disk.
Concurrent runs
Section titled “Concurrent runs”Everything here is per-run, not global. Live node state is keyed by run id first and node id second, which is what lets two workflows animate their own canvases at the same time instead of fighting over one highlight — and why a subworkflow starting does not blank its parent’s progress.
Because dashboard and
atlas builds drive the same tool loop as workflow
runs and emit the same events, they appear here too — a briefing being assembled
at 7am looks like any other run, under the workflow id dashboard:<id> or
atlas:<id>. Subworkflows, map children, and a workflow’s errorWorkflow are
each runs of their own, which is what makes a pipeline of pipelines legible.
Chat turns are the one deliberate exclusion — their run
ids start with chat- and the chat panel already renders them, in more detail.
Opening mid-run
Section titled “Opening mid-run”Open the app while a cron run is halfway through and the feed is not empty. On connect, LatchAI asks the engine what is running, reads those runs’ persisted logs, and replays them through the same reducer the live socket feeds — so the monitor, the canvas and the status bar all catch up to the present. It isn’t a replay mode: this is the current run, with no “(replay)” label, and the live stream takes over from there.
The same catch-up runs again on every reconnect, so a daemon restart under an open window heals itself: the engine’s list of running workflows wins, stale spinners are pruned, and the canvas is rebuilt from the logs.
Stopping and resuming
Section titled “Stopping and resuming”The Runs sidebar is where you act on a run.
- ⏹ Stop cancels a run in flight. One abort signal is threaded all the way
down — agent tool loops, HTTP requests, and every subworkflow and
mapchild — so it cancels the tree, not just the parent. In-flight nodes still settle and log before the run ends withrun.stopped, notrun.failed: nothing went wrong. A stop is final, and a node inside a stopped run never retries. - ▶▶ Resume appears on
interruptedruns only — runs the engine was executing when it died, which the boot sweep marks on the next start. Resume rebuilds the run from its own log plus the workflow on disk and continues under the same run id, appending to the same file. The row then says what happened:resumed — 7 nodes restored, 2 re-running.
A resume is refused, with the reason pinned under the row, when the run was stopped on purpose, is already running, or when the workflow document on disk no longer matches the one the run started against.
Where else a run is visible
Section titled “Where else a run is visible”| Surface | What it holds |
|---|---|
| Run Monitor | Live, chat-shaped, this browser session. Clearing it empties only this view |
| Transcript panel | The same feed scoped to one workflow, docked beside its canvas, with its own run picker and a ⏹ for the run you are reading |
| The canvas | The same events as per-node status and a one-line detail — the tool, the shell exit code, the page a browser_* call landed on |
Events panel (⌘J) |
The raw event lines — kind, node, path, arguments — with clickable file paths and a filter box. Last 200 events; node.delta, model.stats, notification and every chat.* are left out |
| Notifications | A failed run and a run waiting on approval each mint an inbox row, so a 3am death has somewhere to land |
Usage (≣) |
Run history, full transcripts, tokens and cost across runs and restarts |
| Runs sidebar | Every run with its status, a ± diff, ⏹ stop on a running one, ▶▶ resume on an interrupted one, and any orphaned review gates |
<latchHome>/runs/<runId>.jsonl |
The append-only truth. Every event, in order, forever |
Clearing the feed is a view-level action, not a delete: history stays in Usage and on disk.
A few event kinds are worth knowing don’t reach the feed, so you look in the
right place: model.retry (a 429 or dropped socket ridden out — the events
panel and the run log), browser.action (the canvas node card, the events panel, and the
chat row with its thumbnail),
checkpoint.created (the Runs sidebar’s ±, see
checkpoints), and every chat.* including
compaction markers (the chat transcript).
Headless
Section titled “Headless”npm run run <path-to-workflow.json> prints the same stream to stdout — one
timestamped line per event, with agent text written through as it streams:
[14:02:11.402] run.started[14:02:11.905] node.started summarize[14:02:12.140] tool.call summarize read_file {"path":"notes/today.md"}[14:02:12.884] tool.result summarize read_file ok: # Today …[14:02:19.301] run.completedSince 0.9.3 the run log is drained before the process exits, so the JSONL on disk
is complete. Before that, a headless run could print run.completed and leave a
file that stopped several events short — which every later reader (the report, a
resume, the Runs list) saw as an interrupted run.
Reference: the event kinds
Section titled “Reference: the event kinds”Everything above is a rendering of one append-only stream. If you are reading a
.jsonl log or building against
the HTTP API, this is the complete set:
Runs — run.started, run.completed, run.failed, run.stopped,
run.interrupted, trigger.skipped, workflows.changed
Nodes — node.started, node.delta, node.completed, node.retry,
node.failed, node.skipped, state.updated
Tools and side effects — tool.call, tool.result, shell.exec,
web.fetch, browser.action, db.query, file.read, file.written,
file.edited, plan.update, work.updated
Humans in the loop — gate.waiting, gate.resolved,
permission.requested, permission.resolved, permission.denied,
checkpoint.created, notification
Chat — chat.message, chat.delta, chat.reasoning, chat.status,
chat.context, chat.compacted, chat.queued, chat.queue.updated,
chat.queue.removed
Accounting and models — token.usage, model.retry,
dashboard.published, atlas.published, model.loading, model.loaded,
model.unloaded, model.stats, model.worker.crashed,
model.download.started, model.download.progress,
model.download.completed, model.download.failed, model.download.canceled
Three of those never reach a run log: trigger.skipped and workflows.changed
carry no run id (the first is the record of a run that never started), and
neither does notification — they are live-stream chatter, and every chat.*
event belongs to a conversation rather than to a run.
The HTTP surface
Section titled “The HTTP surface”# the last 100 runs, newest first, with live runs overlaidcurl http://127.0.0.1:7777/api/runs
# one run's complete event log, as JSONcurl http://127.0.0.1:7777/api/runs/run-1757390512-7/events
# stop it — 202, or 404 if it is not runningcurl -X POST http://127.0.0.1:7777/api/runs/run-1757390512-7/stop
# resume an interrupted one — 202 with what it restored, 409 otherwisecurl -X POST http://127.0.0.1:7777/api/runs/run-1757390512-7/resumeA successful resume answers with restored (nodes whose recorded output was
replayed), rerun (nodes that will execute again), steps, and lossy — state
keys whose values the log had to clip and cannot recover. That last one is
almost always empty, and it is reported rather than hidden because a resumed run
carrying a silently truncated value would be the one failure a durable run must
not have.