Code Atlas
An atlas is LatchAI’s answer to “I’ve never worked in this codebase — show me how it fits together.” An agent surveys a mounted project, or several that play together, and publishes a set of views: interactive diagrams of the system’s parts, how they connect, and how a request or event flows through them, each with a written guide. The audience is someone new to the code, so views are layered — system first, drill into an area, land on a file.
Like a dashboard, an atlas is a brief handed to an agent with tools, producing a validated document the UI renders. A node on the map opens the real file in the real editor.
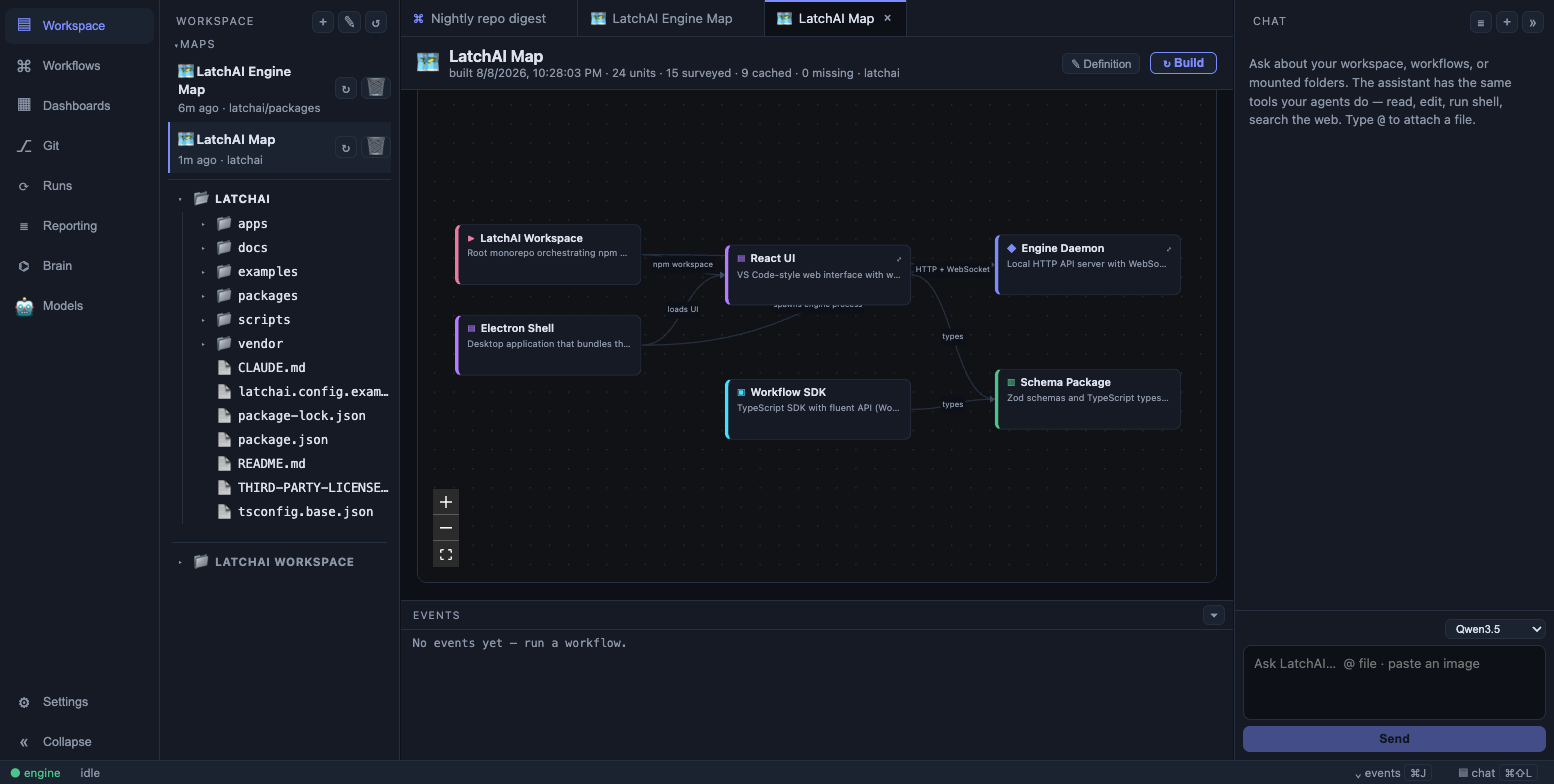
The top-level view: services, stores, and the edges between them.
Make one: hover a folder, press 🗺
Section titled “Make one: hover a folder, press 🗺”There are no questions to answer — describing the map you want assumes you already know the codebase.
- Open the Code area (the file tree).
- Hover a mount root, or one of its top-level folders. A 🗺 button appears on the row.
- Click it.
The tab opens immediately and the survey starts. Behind the button the app posts the folder
to POST /api/atlas/standard, which writes a standard definition — no model call,
nothing to wait for — and then kicks off the build with POST /api/atlas/<id>/run.
The standard definition is the same for every folder: a baked-in newcomer brief (name the
parts, lead with the way in, mark the read-path, then trace how work moves through the
system end to end, and prefer the honest shape over exhaustive coverage), one declared view
called system, flows: 2, the icon 🗺, and a name derived from the folder — payments-api
becomes Payments Api Map, How Payments Api fits together.
The same folder asked for twice opens the same map, not a duplicate, and is only rebuilt
if it has never been built. A folder that isn’t reachable through the workspace or a mount
is refused up front (cannot map "…": not a folder in the workspace or a mounted project).
The 🗺 action is on mount roots and their top-level folders only — the two granularities
worth mapping — and never on LatchAI’s own workspace. The command palette has the same thing
per mount (Visualize: <mount>), plus Open Atlas and Build Atlas for maps you already
have.
Where maps live
Section titled “Where maps live”A Maps section sits at the top of the Code sidebar, above the tree it describes. There is no atlas entry in the activity bar: a code map belongs next to the code.
Each row shows the map’s name and icon, when it last built, its scope, and — the honest bit —
a stale badge counting exactly how many survey units have changed since that build
(stale · 12/240). Hover actions are ↻ build and 🗑 delete. While a build is running the
row draws a progress meter instead: a true surveyed / units fraction during the survey,
then an indeterminate shimmer for the compose step with a live count of views published. The
list polls every four seconds, so a map another window started still catches up. Nothing
here rebuilds on its own.
The section only exists once you have a map: with none, the sidebar is just the file tree, and the 🗺 on a folder row is the way in.
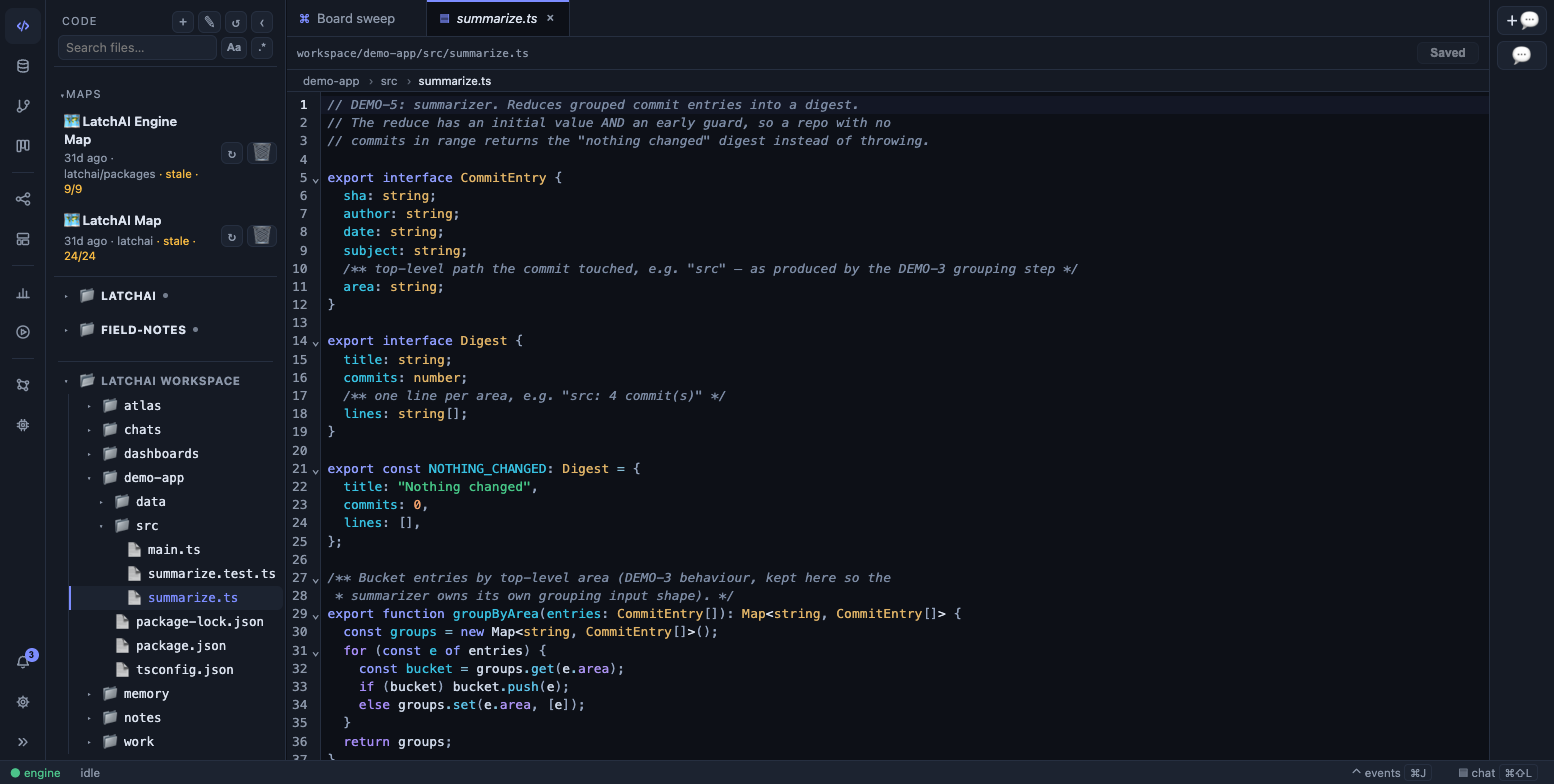
The Maps section above the file tree, with rebuild and delete controls and a stale badge on maps older than the code.
The definition file
Section titled “The definition file”A map is one markdown file, so hand-writing one is a first-class path:
---name: Platform Mapicon: 🗺description: How the client, server, and worker fit together.scope: [projects/api, projects/web]agent: cartographerviews: - system | graph | The whole system - request | flow | Life of an API requestflows: 4---Emphasise the request path and the job queue; the test harness is noise.The reader is a new hire on the backend team.scopeentries are virtual paths — a mount name, or a directory inside one — the same address space the editor and every agent tool use. A single root may also be written as a scalar (scope: projects/api). An entry that doesn’t resolve to a real directory is dropped with a console message, and an atlas left with no usable roots fails its build with a message saying so rather than mapping nothing.viewsentries areid | graph|flow | title. They behave like dashboard slots: the composer must produce every one, by id and kind, and may publish more. Declaring aflowview is how you guarantee a traced path on every build. An unreadable kind falls back tograph.flowsis how many extra flows to trace when none are declared; it defaults to 4, and one-click maps set 2.agentnames an agent definition of yours, supplying persona and model for the composer. Surveyors always run on the default provider.
Open a map and the tab toggles 🗺 View ⇄ ✎ Definition, the same motion dashboards have.
The definition side has every field above as a form, and above it a plain-English box —
describe the change you want and the authoring model rewrites the whole definition. That is
the same endpoint (POST /api/atlas/design) that can author a definition from scratch,
given the real mount names to aim scope at. Save writes <latchHome>/atlas/<id>.md
and snapshots the previous file into version history.
How a build works
Section titled “How a build works”Phase 0 — inventory. Code, not model. The engine walks the scope roots through the
multi-root filesystem — file tree, sizes, a content hash per file — and partitions the tree
into survey units: directory-aligned bundles capped at 30 files or 120KB of source. A
directory holding a package.json, pyproject.toml, go.mod or Cargo.toml starts its own
unit scope; a subtree small enough to be a leftover rather than an area (8 files, 32KB) folds
into its parent’s unit; a directory whose own files blow the cap splits deterministically
into <dir>, <dir>#2, and so on. Dot-entries, node_modules, dist, build, out,
target, vendor, coverage, lockfiles, minified twins and anything over 512KB are
excluded, symlinks are not followed, and only known source, config, schema and docs
extensions are read at all. The result is the run’s manifest — and the next build’s
staleness oracle.
Phase 1 — survey. Every unit whose content hash is already in the card cache is free. The
rest are surveyed three at a time, each by an agent loop with a fresh context holding only
that unit’s file list and exactly three tools: read_file, list_dir, record_card. Its one
output is a card: what this code is for, its public surface, its internals, its
dependencies (internal imports as virtual paths, externals separately), its entry points, a
note per file, and an honest list of what it could not determine. record_card writes that
straight to disk and stamps the unit id and content hash itself, because a model-guessed
cache key would poison every future build. A surveyor that dies leaves a missing card, never
a failed build.
Phase 2 — compose. The engine computes the raw import graph from the cards — unit-to-unit
adjacency, ranked by how many import facts produced each edge — before the composer sees
anything. The composer gets that graph, a one-line index of every card, and the previous
build’s view and node ids, plus read_card to pull a unit’s full facts for the parts it is
about to describe in detail. So it curates: grouping, labelling, deciding what a newcomer
sees first, and publishing the flow views. It is structurally unable to forget an edge, and
forbidden to invent one.
Cards are cached content-addressed and globally at <latchHome>/runs/atlas-cache/, keyed
by the hash of the files they describe. A rebuild therefore costs tokens proportional to
churn, and a multi-project atlas re-surveys nothing a single-project atlas already covered.
What the composer must satisfy
Section titled “What the composer must satisfy”The canonical artifact is graph JSON, zod-validated at publish time: typed nodes, edges,
groups, flows, and narratives. Nodes carry a kind (service, module, ui, store,
queue, external, entry, unsurveyed) and edges carry both a kind (import, call,
http, event, data) and a confidence — whether the relationship was observed in the
source or inferred.
publish_atlas rejects a view and says exactly why, and the composer fixes it on the next
turn:
- Every file on a node must exist, resolved through the multi-root filesystem, and sit inside the atlas’s scope. This is the anti-hallucination check: a model cannot invent a component the filesystem doesn’t corroborate.
- A graph view carries at most 50 nodes. Over that, the answer is never a bigger canvas —
group the units, and give the group’s node a
drillpointing at a deeper view. - Every edge connects two node ids in its own view. No dangling arrows.
- Every flow step lands on a node that exists in a published graph view. Graph views are validated first within a call, so a flow may reference nodes published beside it.
The cards a node names are rewritten to content hashes on the way in — the evidence trail
the model has no way to know. Node ids are asked to be path-derived and stable, and the
previous build’s ids are put in front of the composer, so links and chat references usually
survive a rebuild.
Views merge by id and are published incrementally, so the reader watches the map fill in. A build that publishes nothing is a failed build, not an empty atlas; a build that misses a declared view persists what it did produce and then fails, so a partial map is still there to read while the run log says which slot never arrived.
Reading it
Section titled “Reading it”The header carries the survey’s honesty: when it last built, and 240 units · 31 surveyed · 209 cached · 0 missing. Units that could not be surveyed are counted, listed on hover, and
drawn as unsurveyed nodes rather than quietly dropped.
Start here is an expandable orientation written for a newcomer — what this system is,
what the pieces are called, which view to open first. Below it, a chip per view (◈ graph,
⇢ flow) and that view’s written guide.
The interactive canvas lays the graph out client-side with elkjs, so the model never spends tokens on coordinates. Pan and zoom; a minimap appears past 25 nodes; edge labels hide themselves past 60 edges rather than turning the canvas into soup; groups get a colour legend; inferred edges render dashed, and the legend says so.
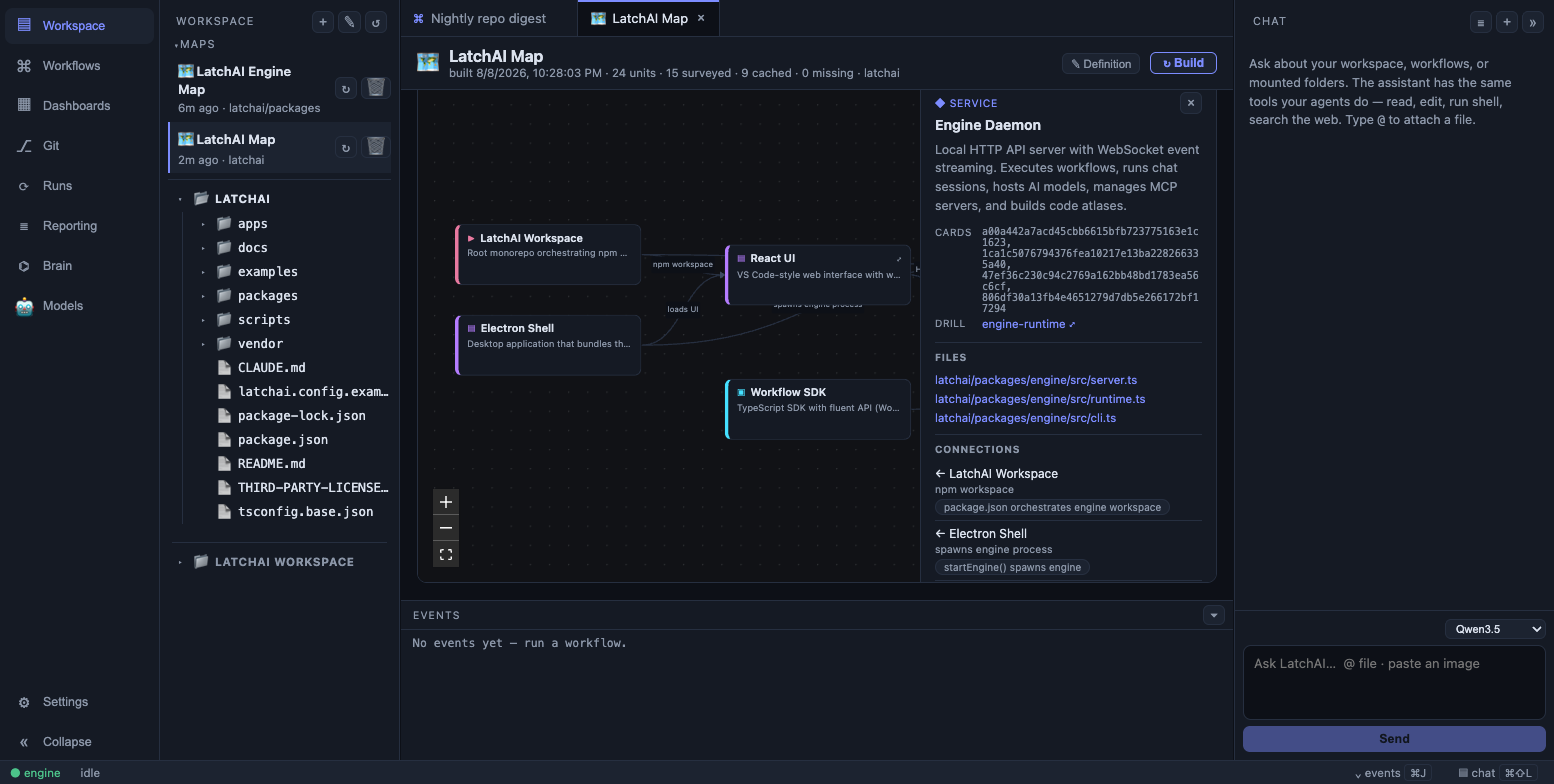
Click a node for its files and the evidence behind each edge.
Click a node and a detail panel opens beside the canvas: its summary, group, size, the card
hashes behind it, its files (click one and the real file opens in the editor — a trailing
:42 is stripped), and its connections, each with direction, kind, whether it was
observed or inferred, and evidence chips that open the file they cite. Double-click a node
carrying drill and the canvas switches to that deeper view.
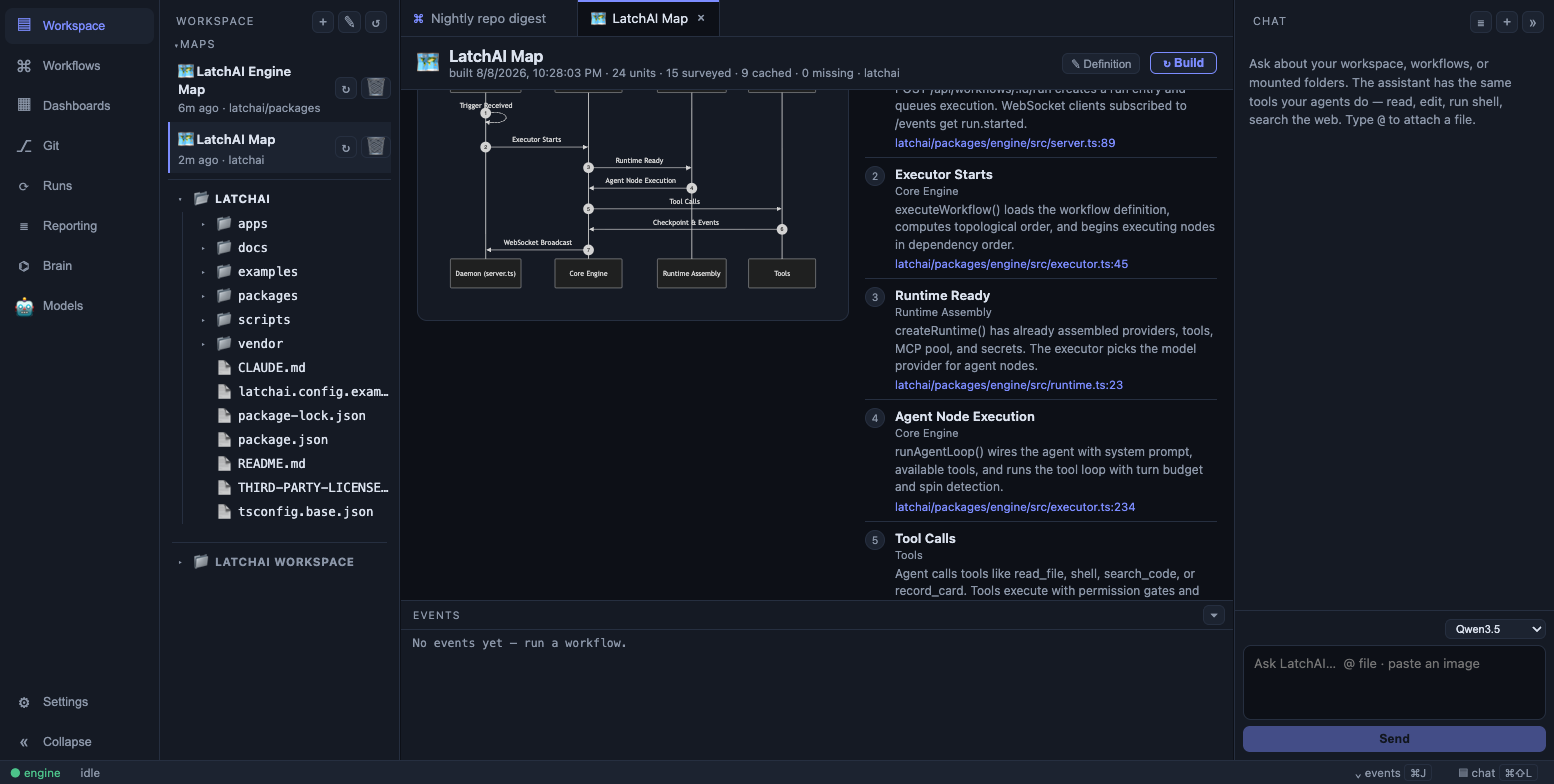
Flow views trace one request or event across the whole system.
Flow views render as a mermaid sequence diagram plus a numbered list of steps — each with
what happens, which part it happens in, and a clickable path:line.
Positions are ephemeral: drag a node to see something better, but nothing is written back, and the next layout re-frames the view.
Staleness and rebuilding
Section titled “Staleness and rebuilding”The stale badge is computed, not guessed, and costs no tokens: a stat-only re-walk of the scope compared against the last build’s manifest. A changed size or mtime, a deleted file, or a new file in a unit’s tree all mark that unit stale.
Rebuilding (↻, or ↻ Build in the tab) re-runs all three phases. Phase 0 is
deterministic, Phase 1 hits the cache for everything that didn’t change, and Phase 2 composes
from scratch with the previous build’s node ids in front of the composer. After a large
refactor, that is the cheapest correct thing: you pay for the units that actually changed.
Builds are ordinary runs
Section titled “Builds are ordinary runs”An atlas build drives the same tool loop as everything else, appears in the
Run Monitor and the token report, returns immediately, and
publishes views as they land. Its events use the run id atlas-<id>-<timestamp> and the
workflow id atlas:<id>; each surveyor is a node called atlas▸survey:<unit> and the
composer is atlas▸compose, so a stalled unit is visible by name. Every published view emits
an atlas.published event, which is what re-renders an open tab live. A surveyor gets 40
turns, the composer 60.
Starting a build while one is in flight returns 409 — the UI treats that as “already
building” and keeps the meter rather than surfacing an error.
Ask about it in chat
Section titled “Ask about it in chat”With a map on screen, the chat dock binds the turn to that atlas: the assistant gets the
brief, the orientation, one line per view with its guide, and a card index — one line per
survey unit, never the full bodies. It pulls a unit’s complete facts on demand with
read_card, and an archived tool payload with atlas_source.
It also holds publish_atlas, so “split the API node into routes and services” or “add a
flow for the webhook path” re-renders the live map.
The files on disk
Section titled “The files on disk”| What | Where |
|---|---|
| Definition — scope + brief | <latchHome>/atlas/<id>.md |
| Document — one build’s output | <latchHome>/runs/atlas/<id>/<ts>.json |
| Manifest — what was surveyed | <latchHome>/runs/atlas/<id>/<ts>.manifest.json |
| Cards — per-unit survey facts | <latchHome>/runs/atlas-cache/<content-hash>.json |
| Source archive — every tool call’s full payload | <latchHome>/runs/atlas/<id>/<ts>.sources/ |
| Vault export | <latchHome>/workspace/atlas/<date>-<id>.md |
The twenty most recent documents are kept per atlas, each pruned with its manifest and archive. The card cache is not pruned — it is the thing that makes the next build cheap.
Mermaid is an export, not the source: the vault export writes each view as a mermaid fence — greppable, Obsidian-ready, and pasteable into a pull request — with the scope, the survey stats, the orientation, every guide, a file list per node, and an Unsurveyed section when there is one.
Honest limits
Section titled “Honest limits”- Surveyor text is not streamed. Three concurrent token streams would drown the Run Monitor and the card is the product, not the prose — their tool calls still show.
- A first build of a large tree is slow, bounded by your provider: one agent loop per changed unit, three at a time.
flows:is guidance, not a guarantee. The composer is asked for that many flow views beyond any you declared, but only a declaredflowview is enforced at the end of a build.- Scope is enforced where it’s checkable — at publish validation and when resolving roots — not in the filesystem layer. Every agent can still see every mount.
- No pinned layouts. Node positions are recomputed each time a view is opened.
- Nothing rebuilds itself. There is no schedule for a map; the stale badge tells you when it is worth a click.