Dynamic Dashboards
A dashboard here is not a saved query. It is a natural-language brief handed to an agent, which collects the data with whatever tools it has — files, shell, git, MCP servers — and then decides how to show it, publishing a validated JSON document the UI renders as widgets.
The same machine produces a morning briefing, a communications board, and a system-status view. Only the brief and the tool allowlist differ.
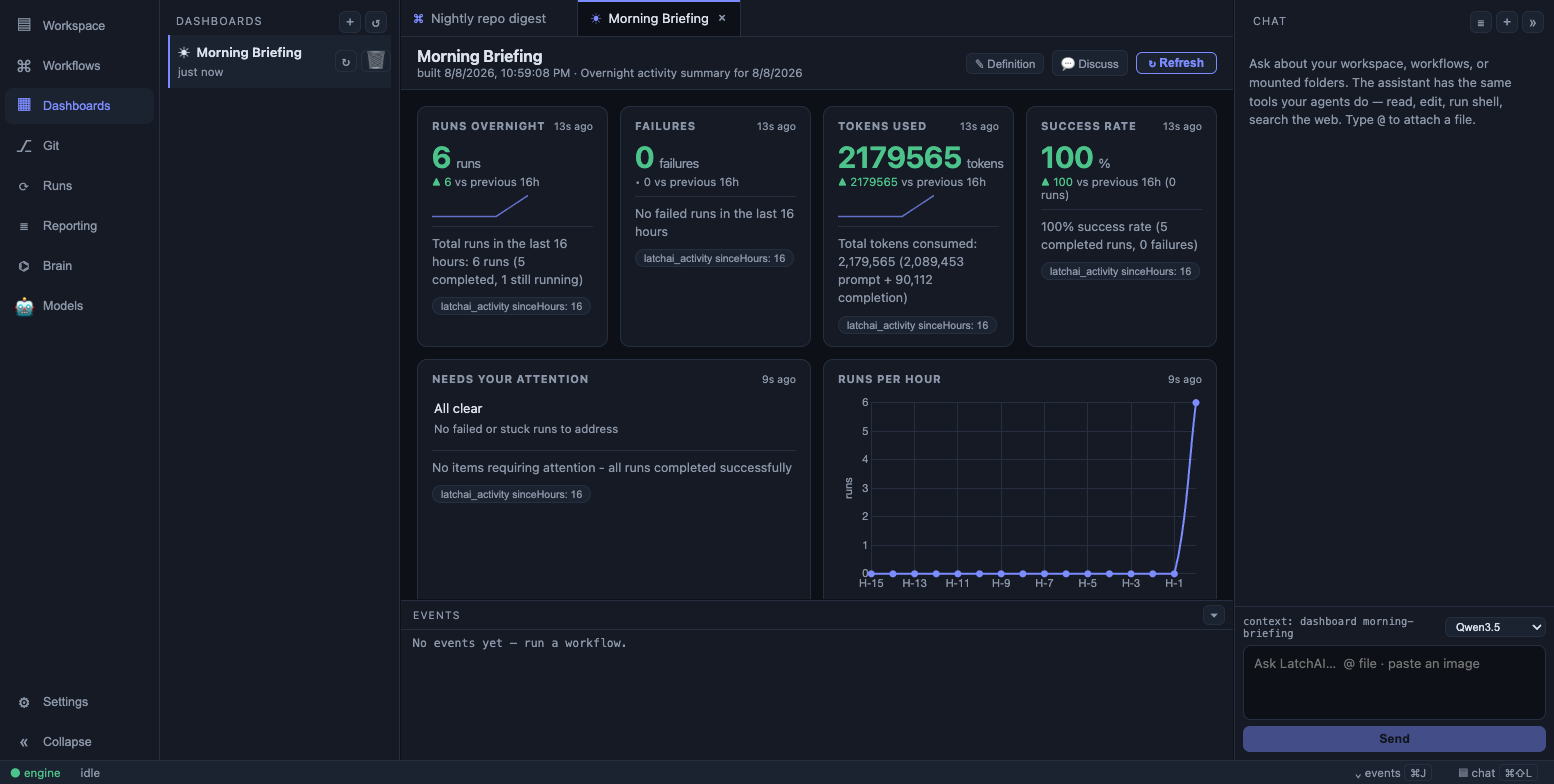
Metrics, a list, a chart, and a written summary — chosen by the agent that gathered them.
Make one
Section titled “Make one”Open the Dashboards area and press + in the sidebar (or New Dashboard in the
command palette). It asks one question: what do you want to see, and how often? Answer in
your own words.
Every morning tell me what happened overnight — how many runs, how many failed, what needs my attention, and a short summary of what you’d do first.
That description goes to an authoring model, which returns a complete definition. It is
written to <latchHome>/dashboards/<id>.md and the tab opens. Nothing runs yet — press
↻ Refresh to build it.
Name exact numbers and charts and you get slots: named widgets pinned on every build. Describe an outcome instead and you get no slots, leaving the agent to pick a presentation from whatever the data turns out to be. Authoring is a single completion rather than a tool loop, and it retries once if the reply isn’t usable JSON.
Your home ships with one already — Morning Briefing (dashboards/morning-briefing.md),
seven slots over latchai_activity, no schedule. Building that one is the fastest way to
see the whole loop.
The definition file
Section titled “The definition file”Everything the agent is told lives in one markdown file: frontmatter for what the runtime must enforce, and a body that is the brief itself.
---name: Morning Briefingicon: ☀description: What happened overnight and what needs me today.refresh: 0 7 * * * # cron expression; omit for manual-onlypaused: true # only written while paused: holds the schedule, ↻ still buildsagent: analyst # optional: an agent you defined, for persona + modellayout: hybrid # pinned | dynamic | hybridtools: [read_file, list_dir, run_shell, latchai_activity]widgets: [metric, list, line, markdown]slots: - overnight | metric | Runs overnight | 3 - attention | list | Needs your attention | 9 - spend | line | Token spend, 7 days | 6---Summarise what happened while I was asleep…Slot entries are id | type | title | span, where type names an entry in the widget
catalog and span is 1–12 grid columns. Slots are the consistency mechanism: they are what
stops a daily briefing from rearranging itself every morning.
tools is an allowlist over the whole tool registry — omit it and
the run gets every tool. widgets narrows the catalog the agent may draw from; omit it and
it gets all of it, and a type named by a slot is always kept regardless. agent names an
agent definition of yours, which supplies the persona, model,
skills and turn budget for the run.
The file is the source of truth. Edit it by hand, keep it in git, or use the editor — every save snapshots the previous version into version history.
Refine it in prose
Section titled “Refine it in prose”The tab toggles ▦ View ⇄ ✎ Definition the way a workflow toggles Canvas ⇄ JSON. The
definition side leads with a plain-English box: type “drop the token count and make the
list full width”, press ⌘⏎, and the same authoring endpoint rewrites the whole
definition, preserving what the instruction didn’t touch. It replaces any unsaved edits in
the form below, and the editor says so.
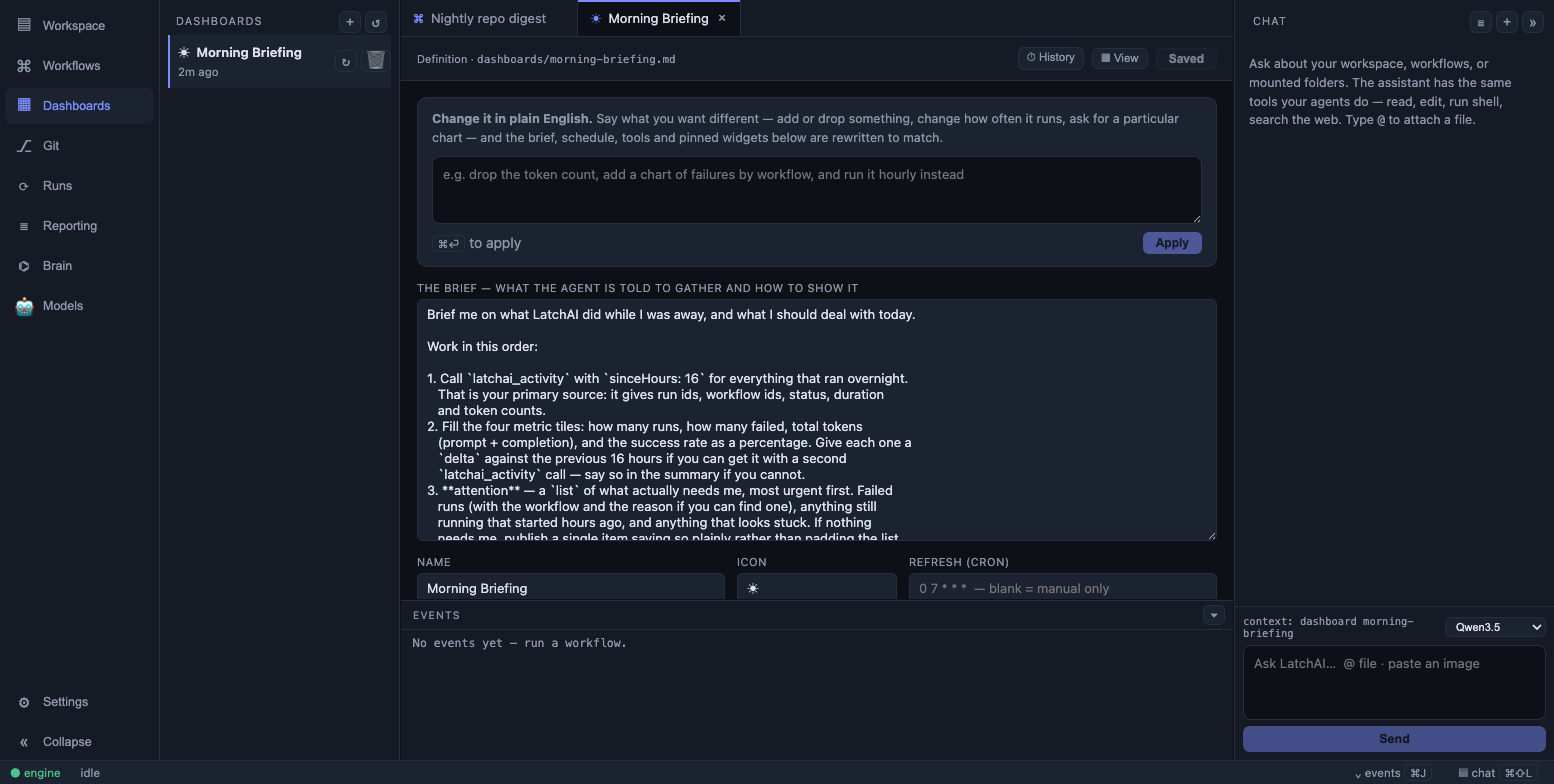
The brief up front; slots, tools, and widget types behind Advanced.
Below the box sit the brief, the name and icon, and a schedule builder. Layout, slots, tools, the widget allowlist and the orchestrator agent are behind an Advanced disclosure — refinement, not entry.
The widget catalog
Section titled “The widget catalog”Widgets are data, not code. Each entry is <latchHome>/widgets/<type>.md:
---name: metricrenderer: metriclabel: Metric tilespan: 3---A single headline number, optionally with a change indicator and a sparkline.Use for "how many" / "how much" answers you want readable at a glance.
data:{ "value": 14, "unit": "runs", "delta": 3, "deltaLabel": "vs yesterday",  "trend": [9, 11, 8, 14], "tone": "ok" }
The body is the text the agent reads — editing it changes how every dashboard is built,
which is where “always use a line chart for time series” is really configured. Twelve types
are seeded into a new home: metric, line, bar, area, donut, table, list,
links, markdown, timeline, status and mermaid. Settings ▸ Widgets edits them,
with a live preview of the renderer against sample data. Any seeded type you delete comes
back on the next start; one you edit is never overwritten.
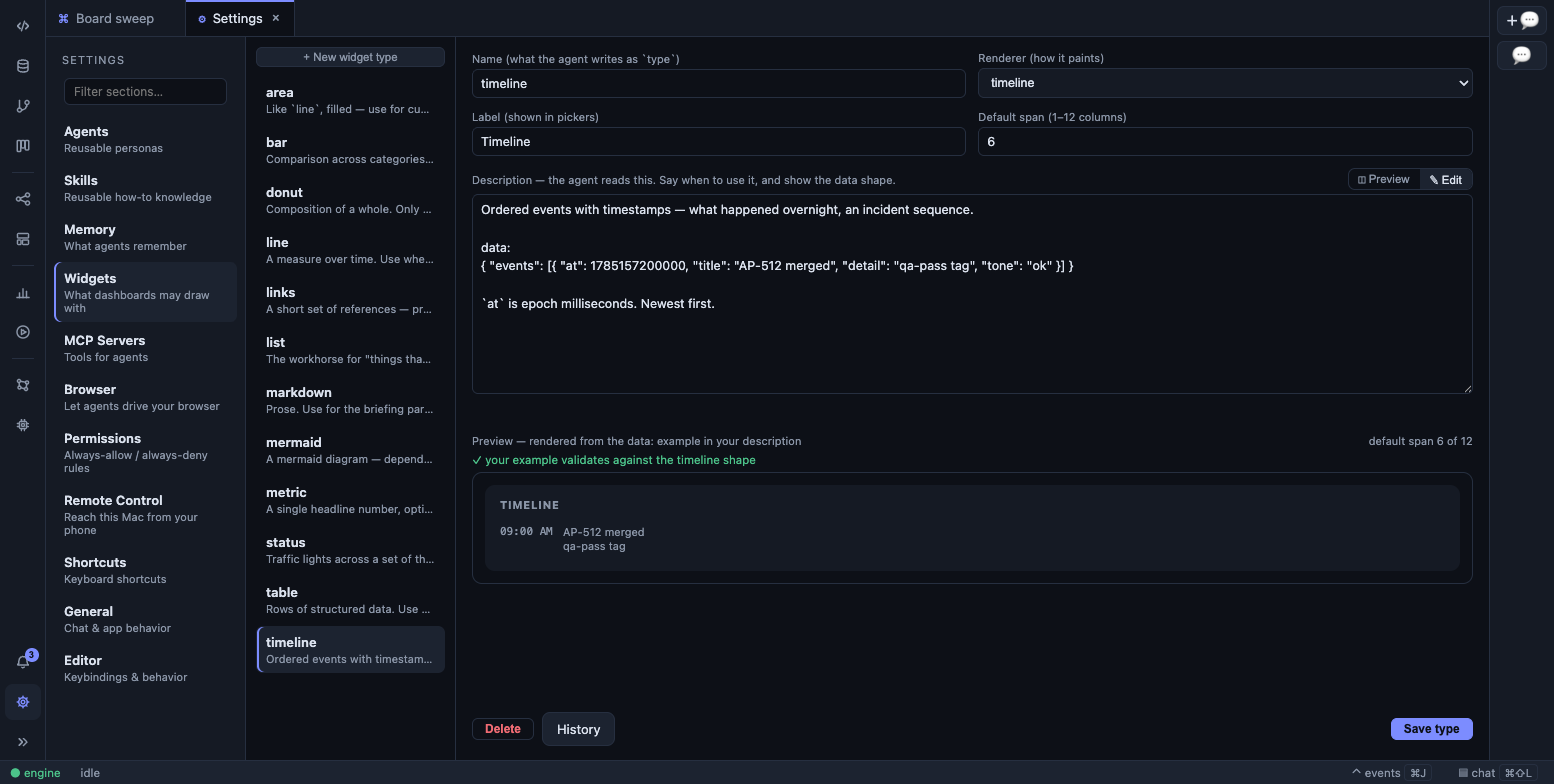
Settings ▸ Widgets: a widget type open for editing, with its live preview.
renderer must name one of the renderers that exist in code — the same twelve names. A type
naming a renderer that doesn’t exist is skipped with a console error rather than letting an
agent publish into a void. You can add as many named types as you like (incidents,
standup) as long as each binds to a real renderer; its data is then validated against that
renderer’s schema.
Layout modes
Section titled “Layout modes”layout |
What the run must produce |
|---|---|
pinned |
Exactly the declared slots. Any other widget id is rejected — which can leave a hole. |
hybrid |
Every declared slot, plus extra widgets when the data warrants. |
dynamic |
No slots; the agent chooses the widgets, their types, order and spans. |
Authored definitions get hybrid when they have slots and dynamic when they don’t; the
authoring model never picks pinned. Select it yourself in the editor when the board’s
shape must not vary.
What the agent publishes
Section titled “What the agent publishes”publish_dashboard validates every widget before it lands and returns the failures to the
model as the tool result, so a wrong shape gets fixed on the next turn instead of silently
vanishing. A widget is rejected when:
- it doesn’t parse as a widget at all (no
id, notype, nodata); - the dashboard is
pinnedand the id isn’t a declared slot; - it fills a declared slot with the wrong type;
- its
typeisn’t in the catalog; - its
datadoesn’t match the renderer’s schema.
Everything that survives is stamped with its resolved renderer, the slot’s title and span when it didn’t supply its own, and a timestamp. Stamping the renderer onto the stored document is what lets an old board still paint correctly after you edit or delete a catalog entry.
Two escape hatches keep one failure from taking the board down: a widget may be published
with status: "error" and an error string (its data isn’t schema-checked, because a
placeholder has none), and widgets merge by id across calls, so an agent is told to
publish each section the moment its data is in hand rather than gathering everything first.
Passing replace: true drops whatever wasn’t in that call instead of merging.
Provenance
Section titled “Provenance”During a dashboard run, every tool result is archived in full before it is truncated for the
model, and the model sees a [source: tN] marker appended to it. The prompt tells it to
carry those refs onto the widget they fed:
{ "id": "overnight", "type": "metric", "title": "Runs overnight", "summary": "14 runs, 3 failed — all three in build-pipeline.", "data": { "value": 14, "unit": "runs", "tone": "warn" }, "sources": [{ "ref": "t3", "label": "latchai_activity · last 12h", "tool": "latchai_activity" }]}Those refs render as a footer under the widget; clicking one opens the archived payload
exactly as the tool returned it. A path opens the file in the editor, a url opens the
browser. Every widget also carries a one-to-three-line summary saying what it shows —
that is what a follow-up conversation reads, so it is written to carry the finding rather
than describe the chart.
Builds are ordinary runs
Section titled “Builds are ordinary runs”A build drives the same tool loop everything else does, so it appears in the
Run Monitor, the run log and the token report for free —
under the run id dash-<id>-<timestamp> and the workflow id dashboard:<id>. Widgets land
via dashboard.published events as the agent produces them, so an open board fills in live.
A run gets 60 turns unless its agent definition says otherwise, and publish_dashboard is
force-added to its allowlist however narrow tools was.
A build starts from an empty board, so a run must republish everything it wants shown. A run that publishes nothing at all fails rather than blanking the dashboard, which is what stops a broken brief from quietly erasing this morning’s briefing.
Refreshing, pausing, resuming
Section titled “Refreshing, pausing, resuming”refresh: arms a cron schedule alongside your workflow triggers,
re-armed whenever the dashboards/ directory changes. ↻ in the sidebar or ↻ Refresh in
the header builds on demand.
⏸ Pause in a scheduled dashboard’s header (or the sidebar row) writes paused: true
into the definition: the cron is not armed, the row dims and the tab shows a paused badge,
and ↻ still builds on demand — a disabled workflow’s exact shape. ▶ Resume clears it.
A revision made through the prose brief inherits the current pause state unless it says
otherwise, so an AI rewrite can’t quietly resume a board you parked.
Only one build of a dashboard runs at a time: a scheduled refresh that comes due while the
previous build is still going is skipped and logged, and a manual
POST /api/dashboards/<id>/run returns 409 rather than starting a second one. The UI
treats that 409 as “already building” and just keeps showing the spinner.
Ask about it in chat
Section titled “Ask about it in chat”With a dashboard tab on screen, the chat dock binds the turn to that board: the assistant
gets the brief, every widget’s summary and displayed data, and an index of the sources —
labels and refs, never payloads. dashboard_source fetches one full payload on demand,
which is how “where did that 14 come from?” gets a real answer rather than a re-derivation.
It also holds publish_dashboard, so “make the failures list full width” re-renders the
live board. A publish from chat starts from the current document rather than an empty one,
so changing one widget is an edit, not a rebuild.
The files on disk
Section titled “The files on disk”| What | Where |
|---|---|
| Definition — the brief | <latchHome>/dashboards/<id>.md |
| Widget catalog — what the agent may draw with | <latchHome>/widgets/<type>.md |
| Document — one build’s output | <latchHome>/runs/dashboards/<id>/<ts>.json |
| Source archive — every tool call’s full payload | <latchHome>/runs/dashboards/<id>/<ts>.sources/ |
| Vault export | <latchHome>/workspace/dashboards/<date>-<id>.md |
The source archive exists so a number on a dashboard can be traced back to the exact tool output it came from; each payload is capped at 256KB and none of it is ever loaded wholesale into a model’s context. The twenty most recent documents per dashboard are kept with their archives; older ones are pruned after a build. The vault export is a permanent markdown note per build day — charts become tables, so it stays greppable.
On your phone
Section titled “On your phone”Every board renders in the phone app too, in one column, filling in live as an agent collects. All twelve widget types are redrawn for a thumb, and charts reuse the workbench’s own Chart.js renderer. Refresh from the phone needs Let paired phones start work turned on in Settings ▸ Remote Control; without it the board is read-only and waits for its next scheduled build.